Potassium »
PDB 8ooi-8qos »
8p4p »
Potassium in PDB 8p4p: Structure Average of GROEL14 Complexes Found in the Cytosol of Escherichia Coli Overexpressing Groel Obtained By Cryo Electron Tomography
Other elements in 8p4p:
The structure of Structure Average of GROEL14 Complexes Found in the Cytosol of Escherichia Coli Overexpressing Groel Obtained By Cryo Electron Tomography also contains other interesting chemical elements:
| Magnesium | (Mg) | 14 atoms |
Potassium Binding Sites:
Pages:
>>> Page 1 <<< Page 2, Binding sites: 11 - 14;Binding sites:
The binding sites of Potassium atom in the Structure Average of GROEL14 Complexes Found in the Cytosol of Escherichia Coli Overexpressing Groel Obtained By Cryo Electron Tomography (pdb code 8p4p). This binding sites where shown within 5.0 Angstroms radius around Potassium atom.In total 14 binding sites of Potassium where determined in the Structure Average of GROEL14 Complexes Found in the Cytosol of Escherichia Coli Overexpressing Groel Obtained By Cryo Electron Tomography, PDB code: 8p4p:
Jump to Potassium binding site number: 1; 2; 3; 4; 5; 6; 7; 8; 9; 10;
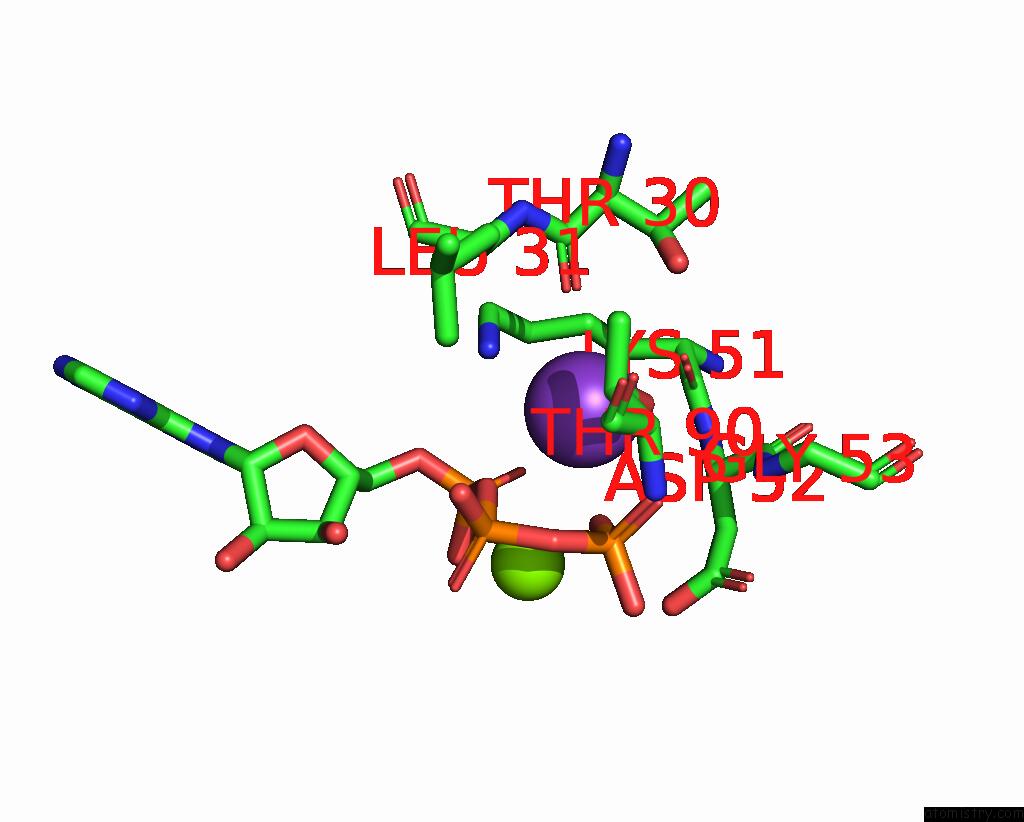
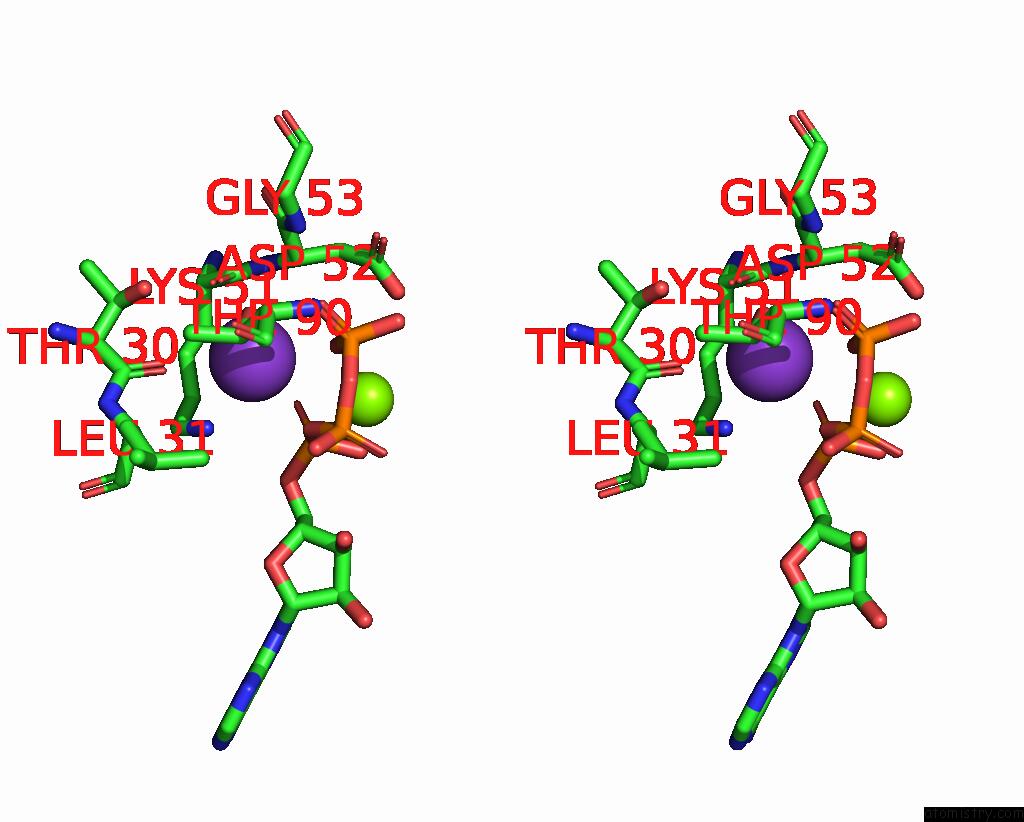
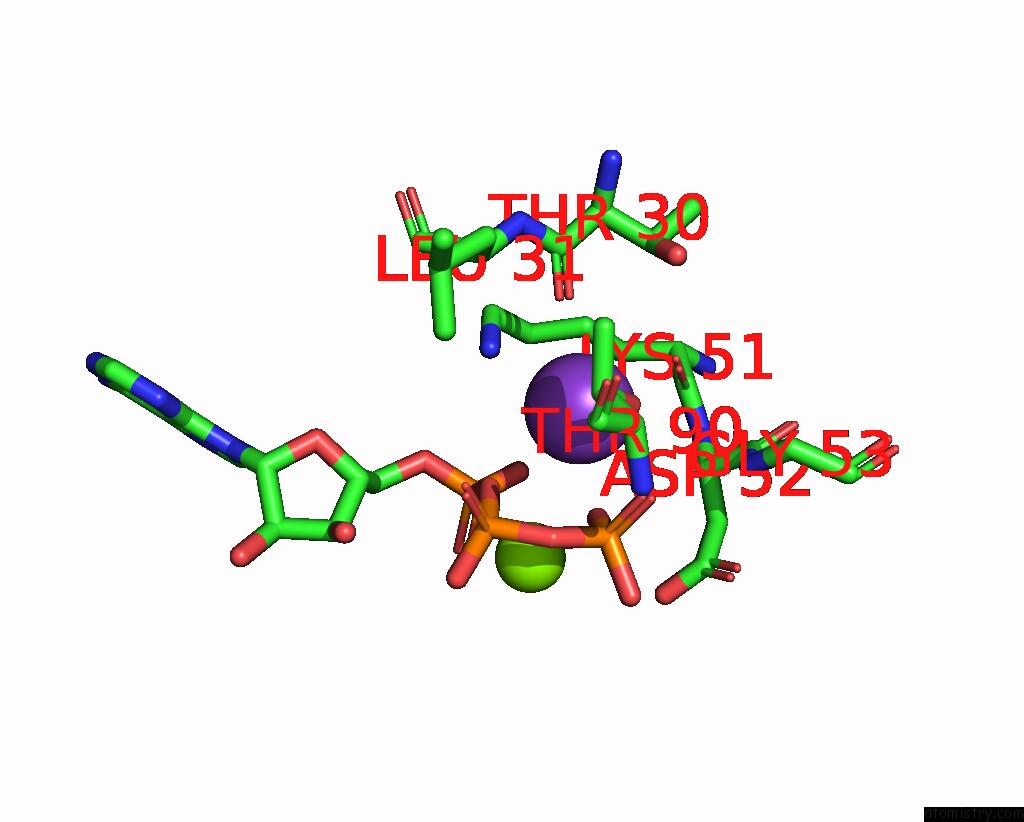
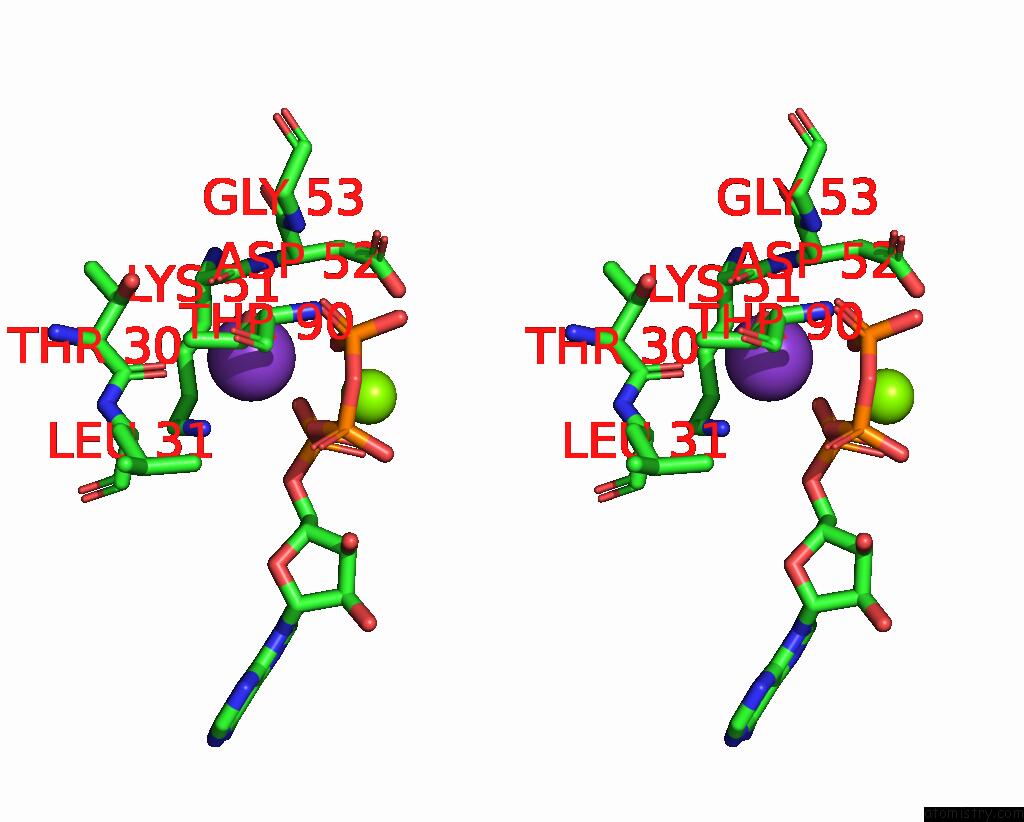
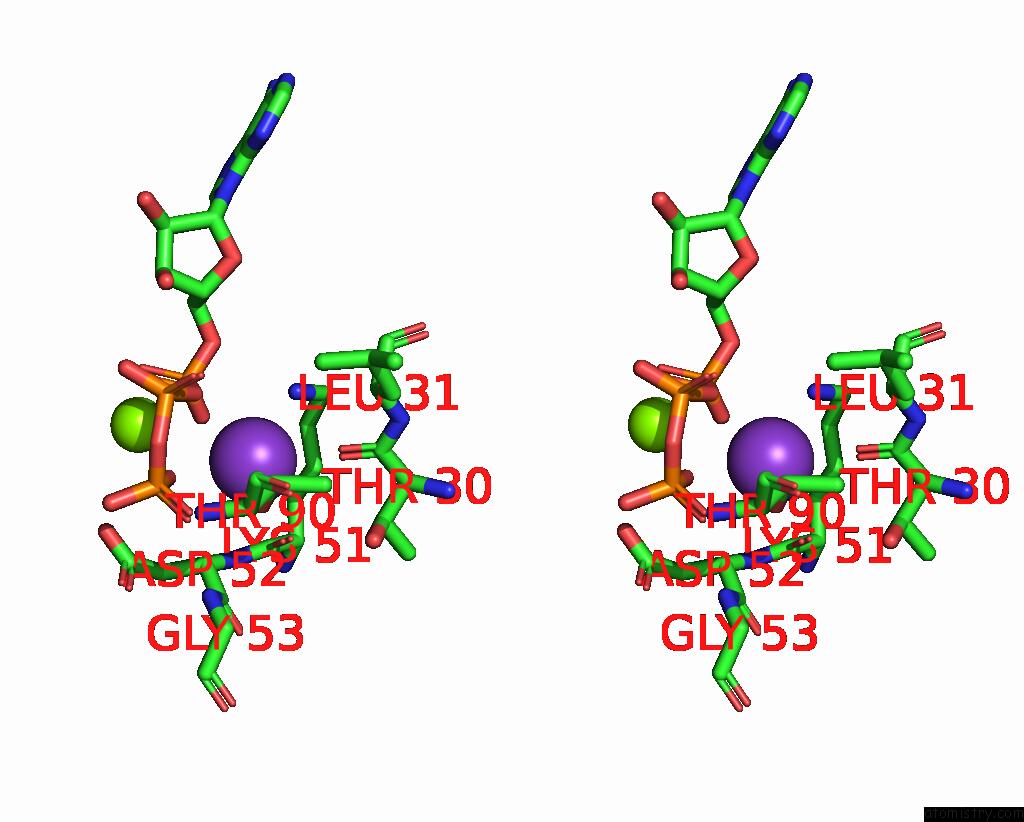
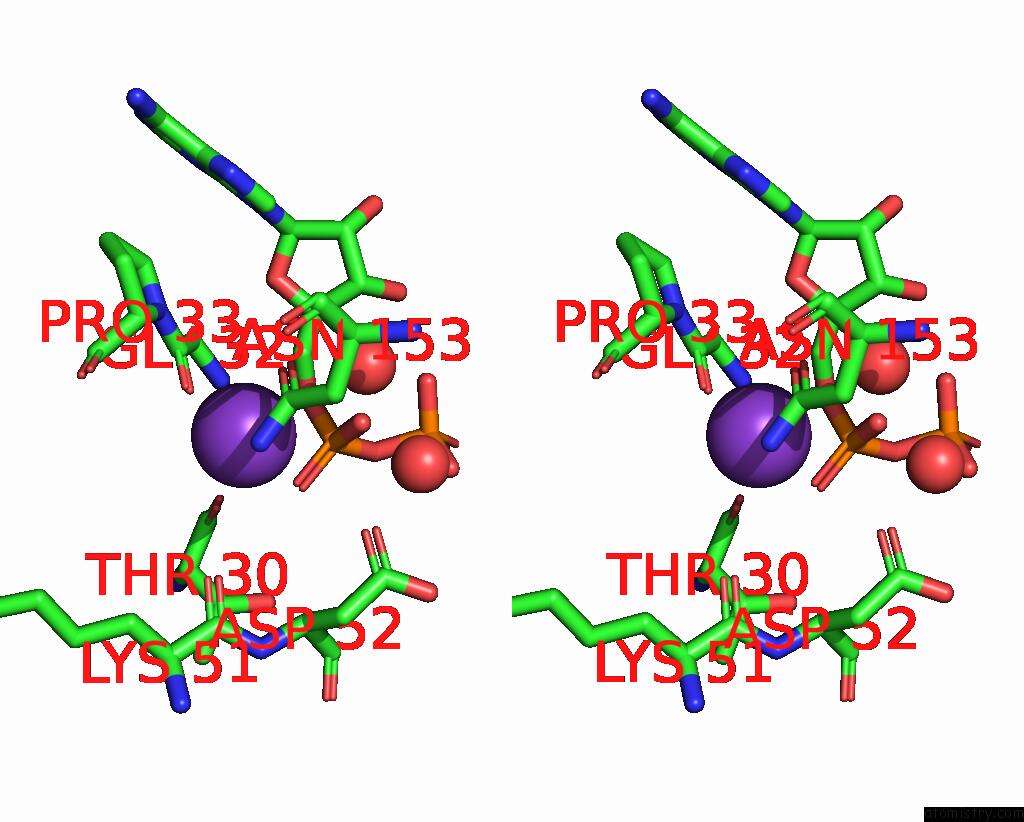
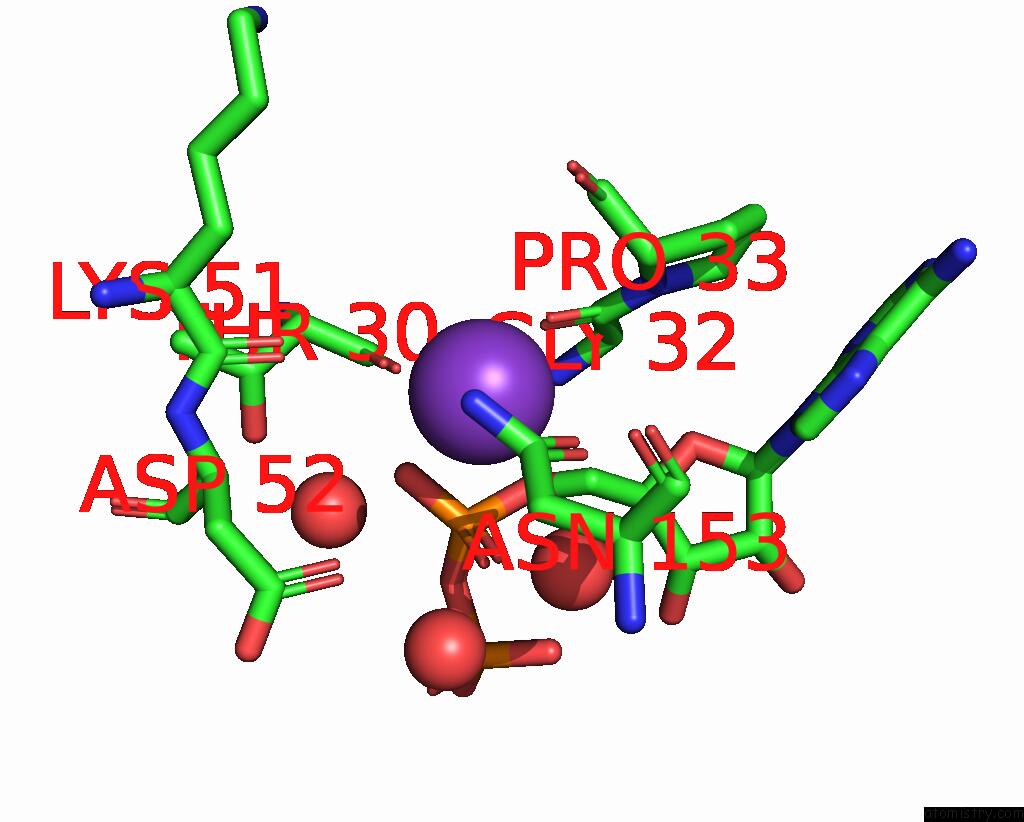
Potassium binding site 1 out of 14 in 8p4p
Go back to
Potassium binding site 1 out
of 14 in the Structure Average of GROEL14 Complexes Found in the Cytosol of Escherichia Coli Overexpressing Groel Obtained By Cryo Electron Tomography
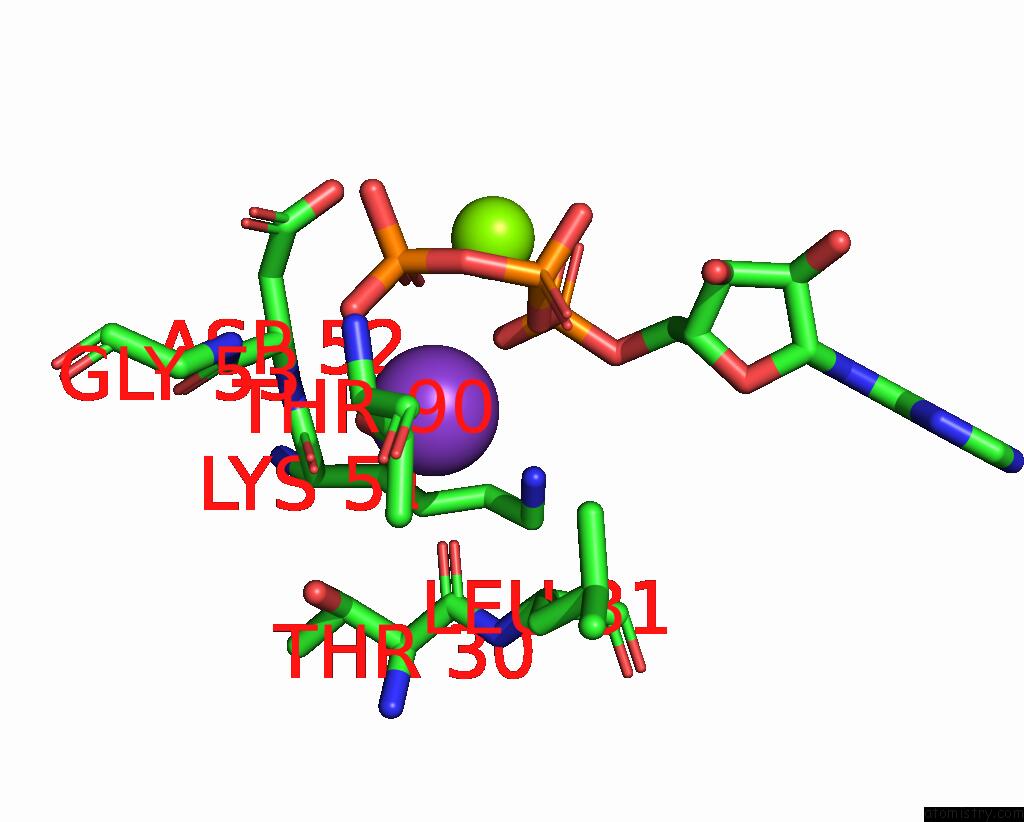
Mono view
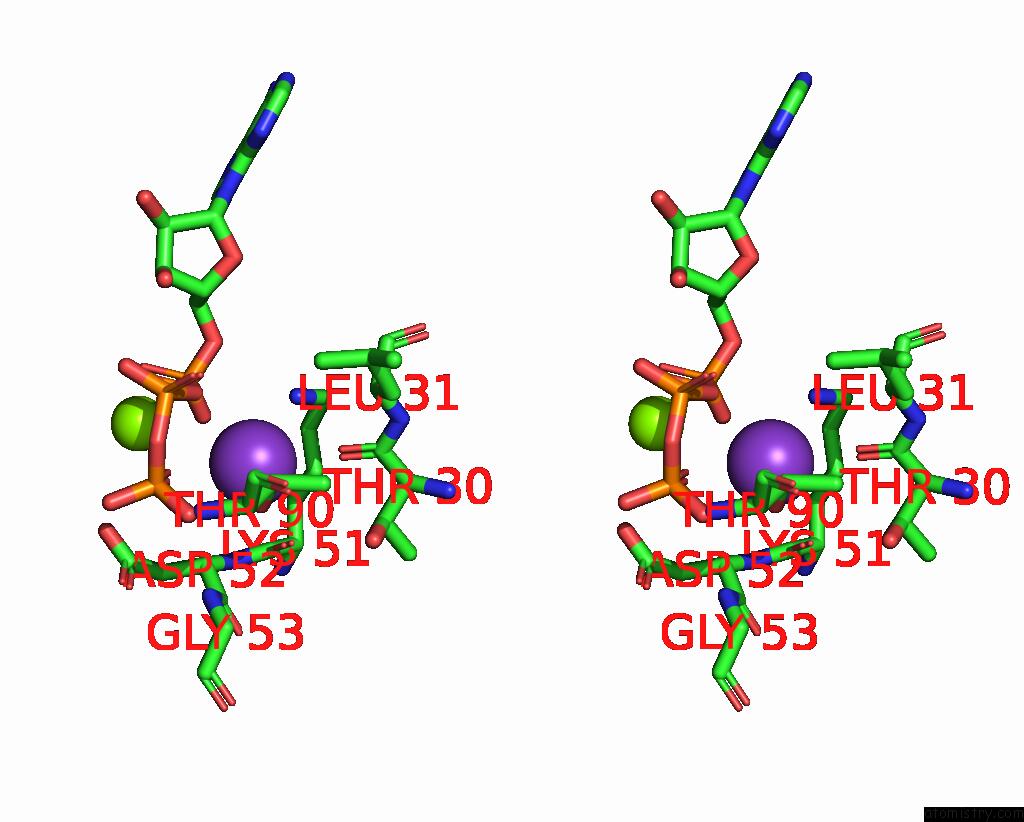
Stereo pair view
Mono view
Stereo pair view
A full contact list of Potassium with other atoms in the K binding
site number 1 of Structure Average of GROEL14 Complexes Found in the Cytosol of Escherichia Coli Overexpressing Groel Obtained By Cryo Electron Tomography within 5.0Å range:
|
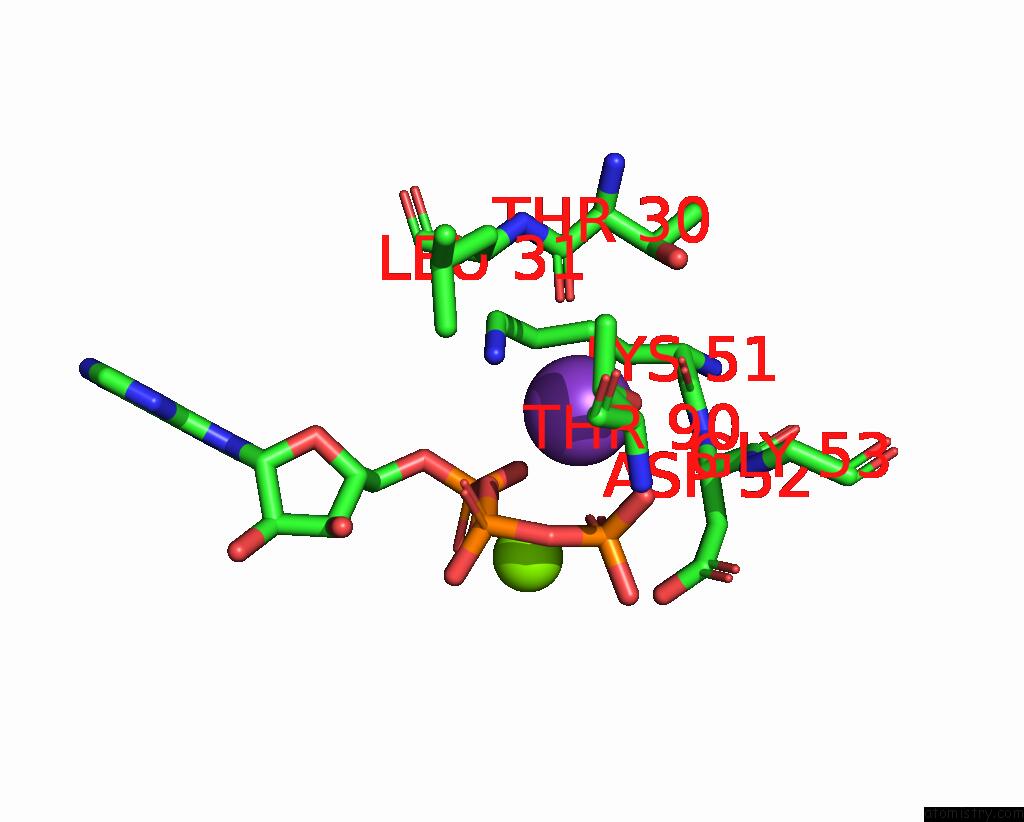
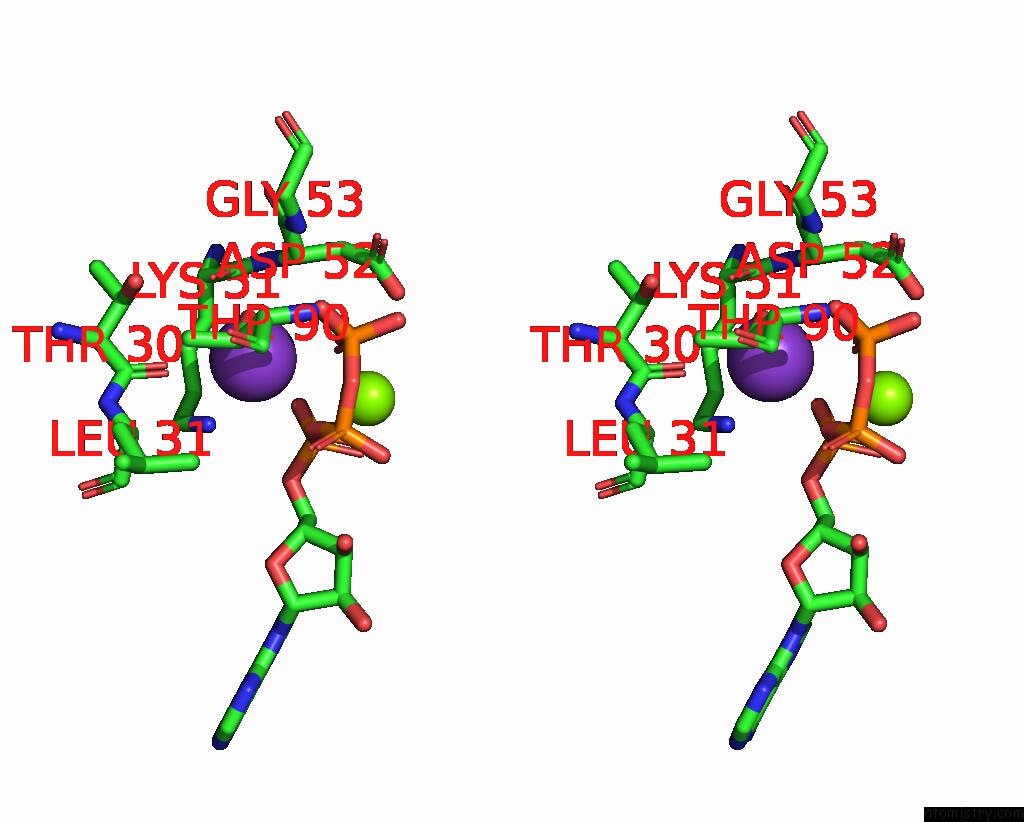
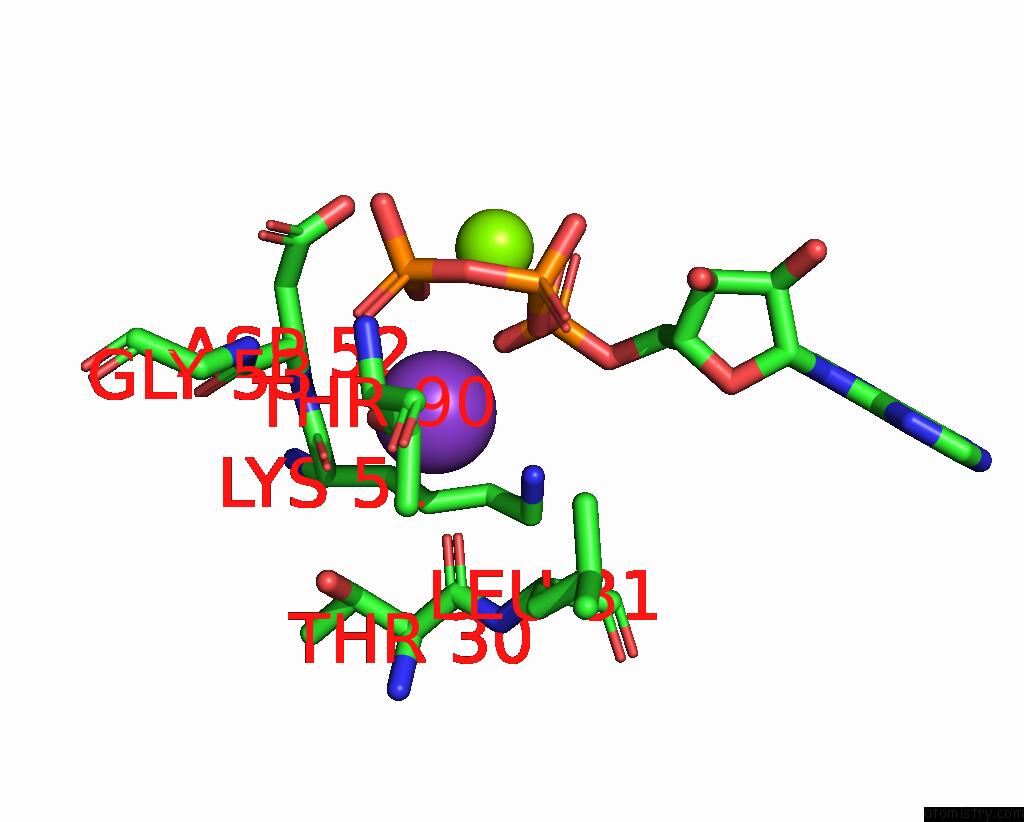
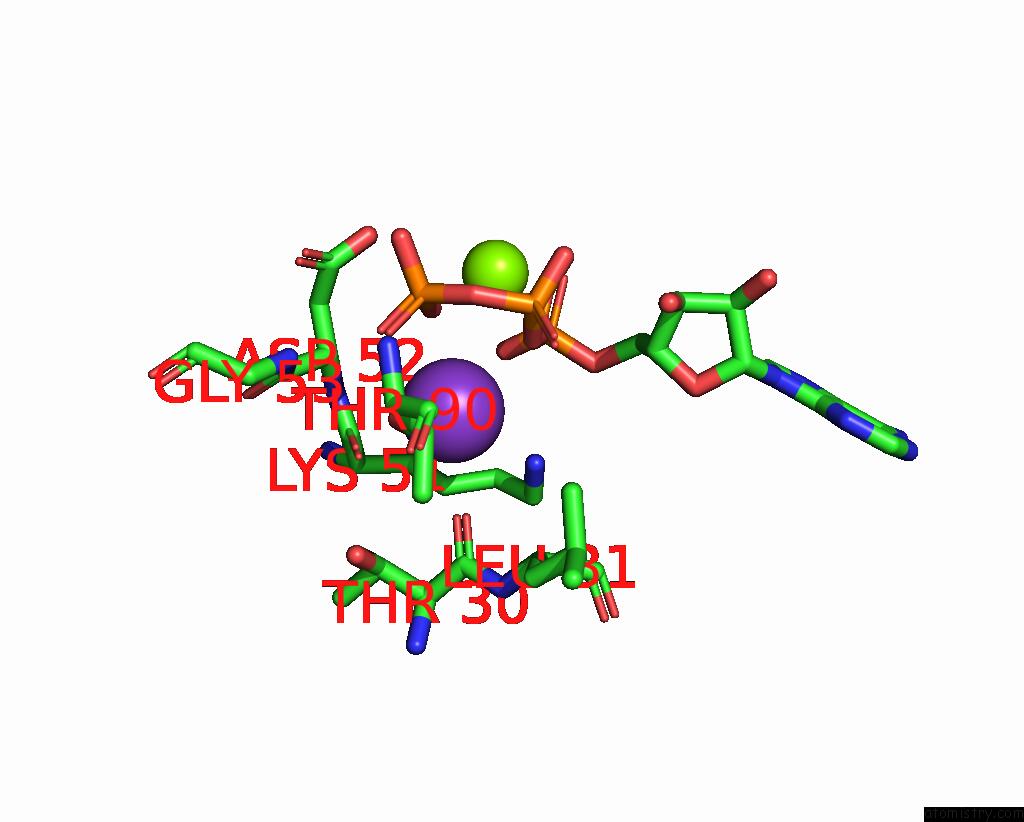
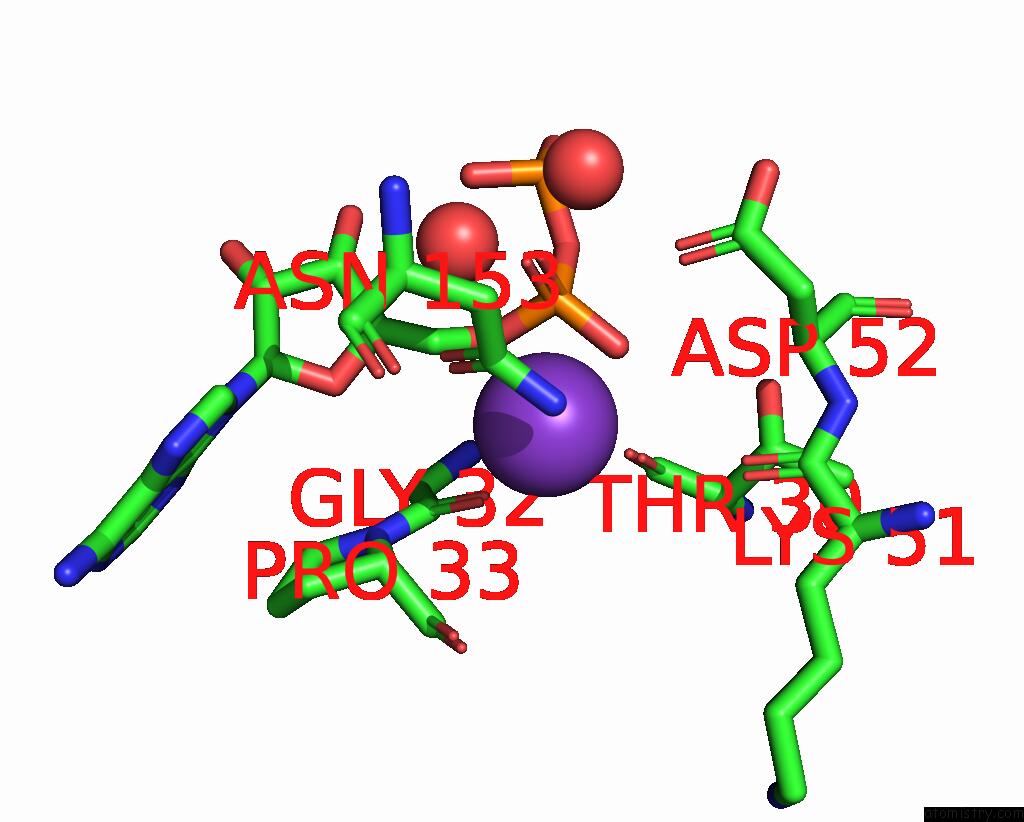
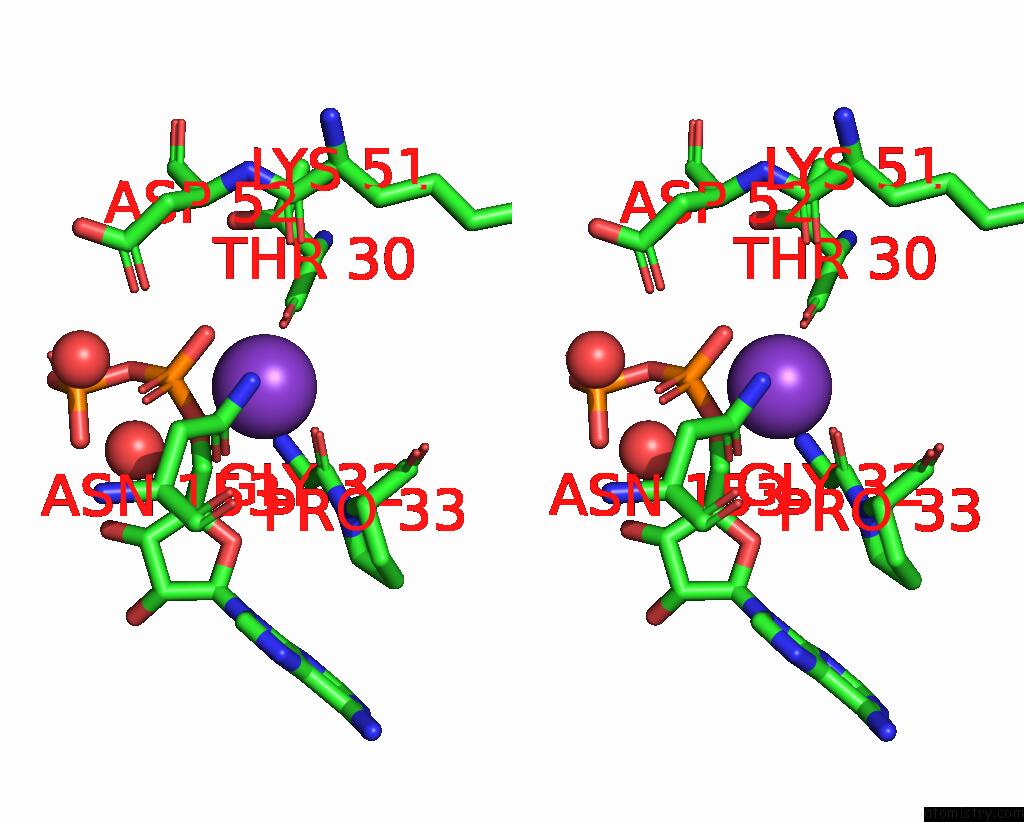
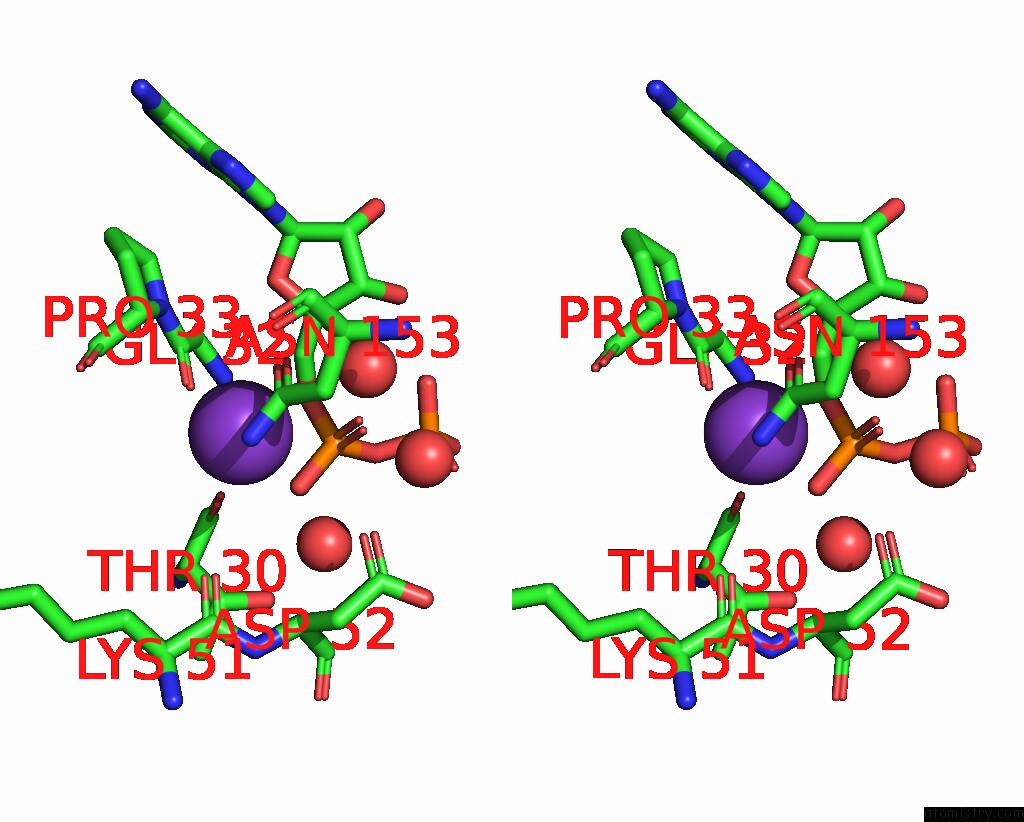
Potassium binding site 2 out of 14 in 8p4p
Go back to
Potassium binding site 2 out
of 14 in the Structure Average of GROEL14 Complexes Found in the Cytosol of Escherichia Coli Overexpressing Groel Obtained By Cryo Electron Tomography
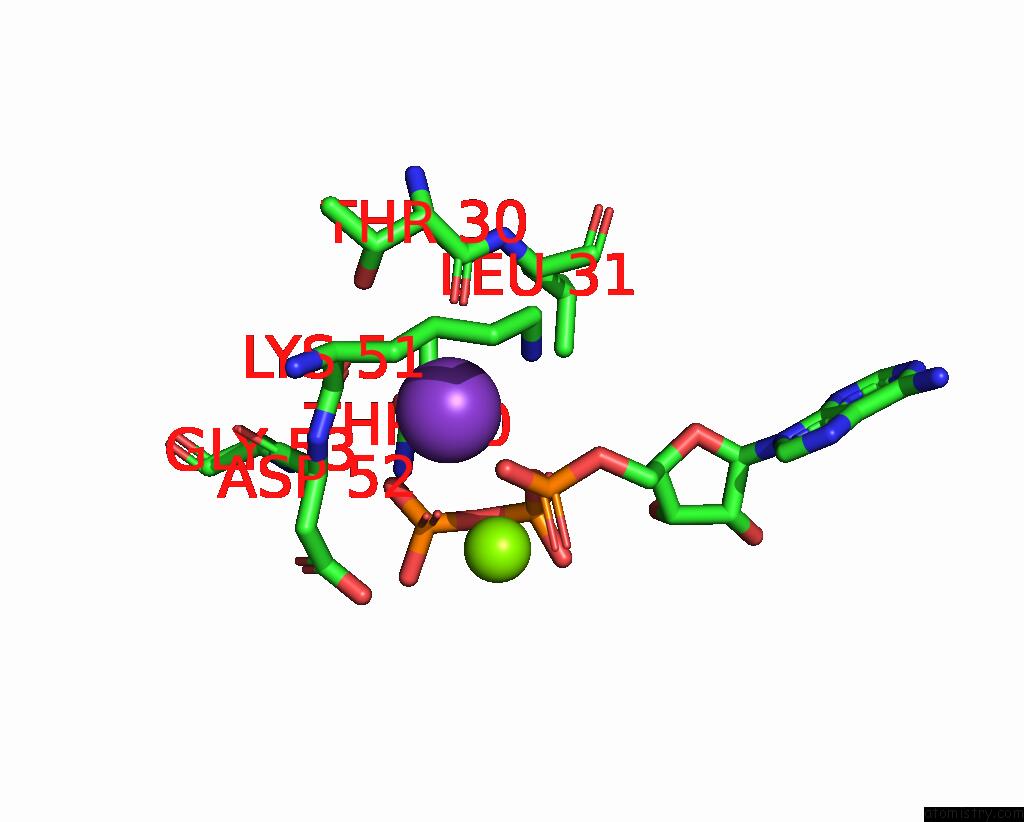
Mono view
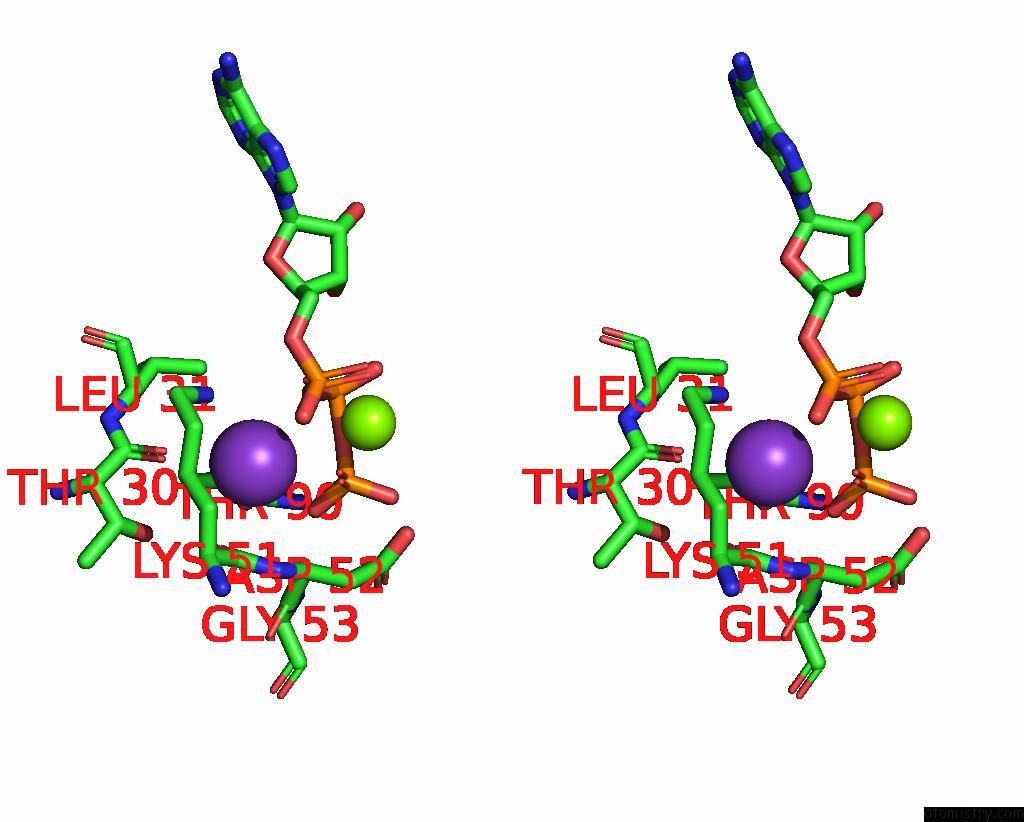
Stereo pair view
Mono view
Stereo pair view
A full contact list of Potassium with other atoms in the K binding
site number 2 of Structure Average of GROEL14 Complexes Found in the Cytosol of Escherichia Coli Overexpressing Groel Obtained By Cryo Electron Tomography within 5.0Å range:
|
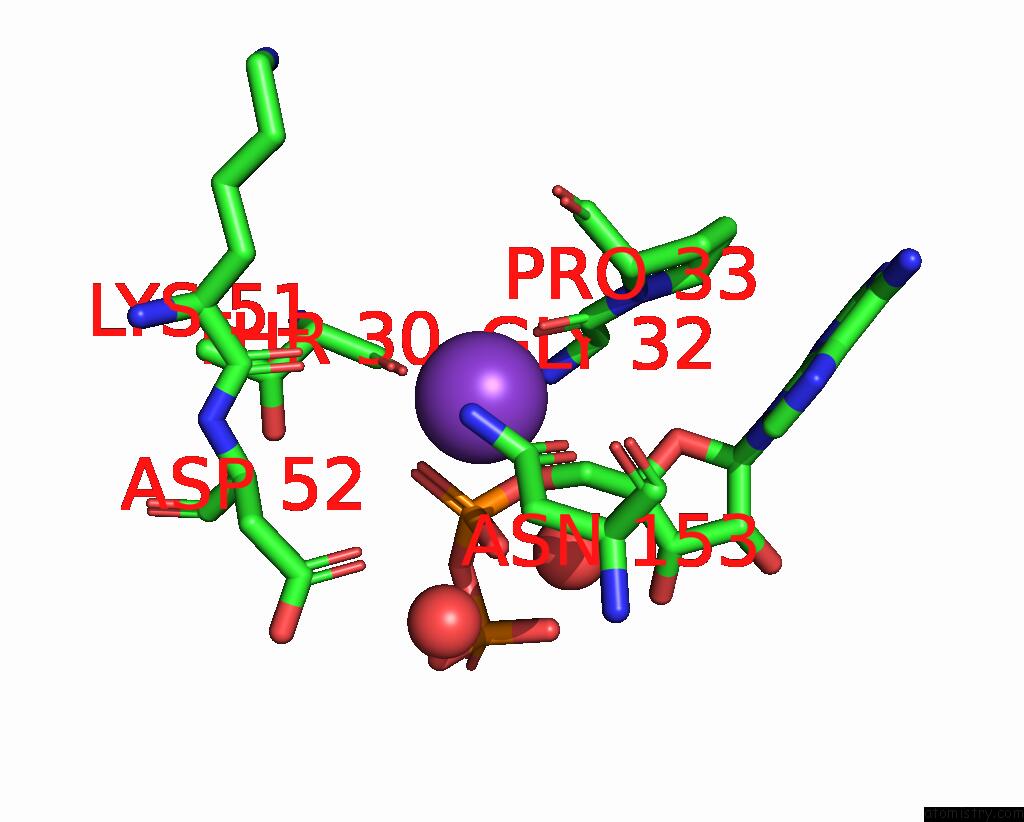
Potassium binding site 3 out of 14 in 8p4p
Go back to
Potassium binding site 3 out
of 14 in the Structure Average of GROEL14 Complexes Found in the Cytosol of Escherichia Coli Overexpressing Groel Obtained By Cryo Electron Tomography
Mono view
Stereo pair view
Mono view
Stereo pair view
A full contact list of Potassium with other atoms in the K binding
site number 3 of Structure Average of GROEL14 Complexes Found in the Cytosol of Escherichia Coli Overexpressing Groel Obtained By Cryo Electron Tomography within 5.0Å range:
|
Potassium binding site 4 out of 14 in 8p4p
Go back to
Potassium binding site 4 out
of 14 in the Structure Average of GROEL14 Complexes Found in the Cytosol of Escherichia Coli Overexpressing Groel Obtained By Cryo Electron Tomography
Mono view
Stereo pair view
Mono view
Stereo pair view
A full contact list of Potassium with other atoms in the K binding
site number 4 of Structure Average of GROEL14 Complexes Found in the Cytosol of Escherichia Coli Overexpressing Groel Obtained By Cryo Electron Tomography within 5.0Å range:
|
Potassium binding site 5 out of 14 in 8p4p
Go back to
Potassium binding site 5 out
of 14 in the Structure Average of GROEL14 Complexes Found in the Cytosol of Escherichia Coli Overexpressing Groel Obtained By Cryo Electron Tomography
Mono view
Stereo pair view
Mono view
Stereo pair view
A full contact list of Potassium with other atoms in the K binding
site number 5 of Structure Average of GROEL14 Complexes Found in the Cytosol of Escherichia Coli Overexpressing Groel Obtained By Cryo Electron Tomography within 5.0Å range:
|
Potassium binding site 6 out of 14 in 8p4p
Go back to
Potassium binding site 6 out
of 14 in the Structure Average of GROEL14 Complexes Found in the Cytosol of Escherichia Coli Overexpressing Groel Obtained By Cryo Electron Tomography
Mono view

Stereo pair view
Mono view
Stereo pair view
A full contact list of Potassium with other atoms in the K binding
site number 6 of Structure Average of GROEL14 Complexes Found in the Cytosol of Escherichia Coli Overexpressing Groel Obtained By Cryo Electron Tomography within 5.0Å range:
|
Potassium binding site 7 out of 14 in 8p4p
Go back to
Potassium binding site 7 out
of 14 in the Structure Average of GROEL14 Complexes Found in the Cytosol of Escherichia Coli Overexpressing Groel Obtained By Cryo Electron Tomography
Mono view
Stereo pair view
Mono view
Stereo pair view
A full contact list of Potassium with other atoms in the K binding
site number 7 of Structure Average of GROEL14 Complexes Found in the Cytosol of Escherichia Coli Overexpressing Groel Obtained By Cryo Electron Tomography within 5.0Å range:
|
Potassium binding site 8 out of 14 in 8p4p
Go back to
Potassium binding site 8 out
of 14 in the Structure Average of GROEL14 Complexes Found in the Cytosol of Escherichia Coli Overexpressing Groel Obtained By Cryo Electron Tomography
Mono view
Stereo pair view
Mono view
Stereo pair view
A full contact list of Potassium with other atoms in the K binding
site number 8 of Structure Average of GROEL14 Complexes Found in the Cytosol of Escherichia Coli Overexpressing Groel Obtained By Cryo Electron Tomography within 5.0Å range:
|
Potassium binding site 9 out of 14 in 8p4p
Go back to
Potassium binding site 9 out
of 14 in the Structure Average of GROEL14 Complexes Found in the Cytosol of Escherichia Coli Overexpressing Groel Obtained By Cryo Electron Tomography
Mono view
Stereo pair view
Mono view
Stereo pair view
A full contact list of Potassium with other atoms in the K binding
site number 9 of Structure Average of GROEL14 Complexes Found in the Cytosol of Escherichia Coli Overexpressing Groel Obtained By Cryo Electron Tomography within 5.0Å range:
|
Potassium binding site 10 out of 14 in 8p4p
Go back to
Potassium binding site 10 out
of 14 in the Structure Average of GROEL14 Complexes Found in the Cytosol of Escherichia Coli Overexpressing Groel Obtained By Cryo Electron Tomography
Mono view
Stereo pair view
Mono view
Stereo pair view
A full contact list of Potassium with other atoms in the K binding
site number 10 of Structure Average of GROEL14 Complexes Found in the Cytosol of Escherichia Coli Overexpressing Groel Obtained By Cryo Electron Tomography within 5.0Å range:
|
Reference:
J.Wagner,
A.I.Caravajal,
F.Beck,
A.Bracher,
W.Wan,
S.Bohn,
R.Koerner,
W.Baumeister,
R.Fernandez-Busnadiego,
F.U.Hartl.
Visualizing Chaperonin Function in Situ By Cryo-Electron Tomography Nature 2024.
ISSN: ESSN 1476-4687
Page generated: Sat Aug 9 17:24:14 2025
ISSN: ESSN 1476-4687
Last articles
Mg in 3G5AMg in 3G5S
Mg in 3G58
Mg in 3G4T
Mg in 3G4L
Mg in 3G4K
Mg in 3G4I
Mg in 3G4G
Mg in 3G4F
Mg in 3G45